
Class 11PhysicsOscillationsDifferent types of oscillations (Free, Damped, Forced Oscillation and Resonance)
EasyWhich of the diagrams shown in the figure represents the variation of the total mechanical energy of a pendulum oscillating in water as a function of time?
- A
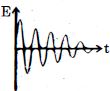
- B
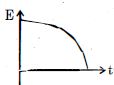
- C
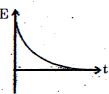
- D
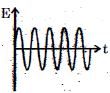
Explore More
Similar Questions
$A$ block of mass $200 \, g$ is executing $SHM$ under the influence of a spring with spring constant $K = 90 \, N \, m^{-1}$ and a damping constant $b = 40 \, g \, s^{-1}$. The time elapsed for its amplitude to drop to half of its initial value is ...... $s$ (Given $\ln \frac{1}{2} = -0.693$).
Medium
View SolutionThe amplitude of a damped oscillator decreases to $0.9$ times its original magnitude in $5 \ s$. In another $10 \ s$ it will decrease to $\alpha$ times its original magnitude,where $\alpha$ equals
$Assertion :$ The amplitude of an oscillating pendulum decreases gradually with time.
$Reason :$ The frequency of the pendulum decreases with time.
$Reason :$ The frequency of the pendulum decreases with time.
The amplitude of a damped oscillator is known to decrease to $0.9$ times its original amplitude in $5 \,s$. Approximately, by how many times its original amplitude will it decrease after another $20 \,s$?
Explain the behaviour of the oscillator when the driving frequency is close to the natural frequency in small damped oscillation and define resonance.
Easy
View SolutionVedclass Products
For Students
Vedclass Test Series
Mock tests in real JEE/NEET style with performance analysis. 5-day free trial.
Start Free TrialFor Teachers
Exam Paper Generator
Generate Set A/B/C/D exam papers from 7.5L+ questions in 2 minutes. 3 chapters free.
Try FreeFor Institutes
Online Exam Module
Live online exams with unlimited students, 360° analytics & white-label branding.
See Demo